Actions
Bug #4759
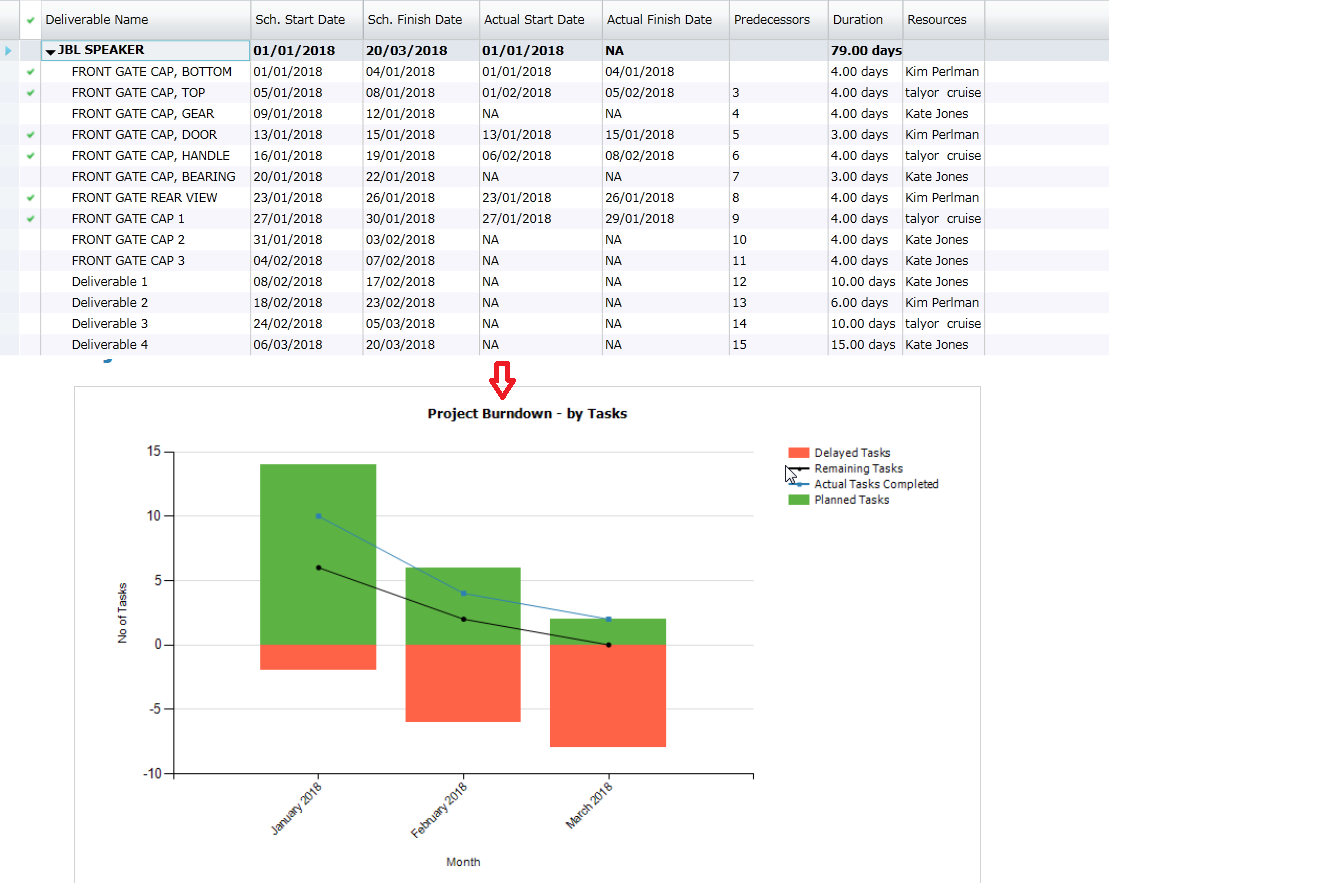
closedReport: Burndown chart does not display the correct values on the graph for remaining and Actual task completed.
Status:
Closed
Priority:
Medium
Assignee:
-
Start date:
02/13/2018
Due date:
% Done:
0%
Estimated time:
Steps To Reproduce:
1)Login into EWQIMS Application
2)Select APQP module
3)Click on reports tab
4)Click on BURN DOWN CHART menu
5)Select Pillar and project
6)Click on View Report
7)Observe the result in the graph
MODULES:
APQPPPAP MGR
Build Cycle:
Reports
Customer:
Issue Dependency:
Dev Commitment to Resolve in::
Description
Report: Burn down chart does not display the correct values on the graph for remaining task and Actual task completed.
Files
Actions