Actions
Bug #1628
closedBurndown chart does not display the correct values on the graph
Status:
Closed
Priority:
Medium
Assignee:
-
Start date:
08/30/2017
Due date:
% Done:
0%
Estimated time:
Steps To Reproduce:
Prerequisite - Create a project with a task completed on time
1. Navigate to Reports -> Burndown chart
2. Select the created project.
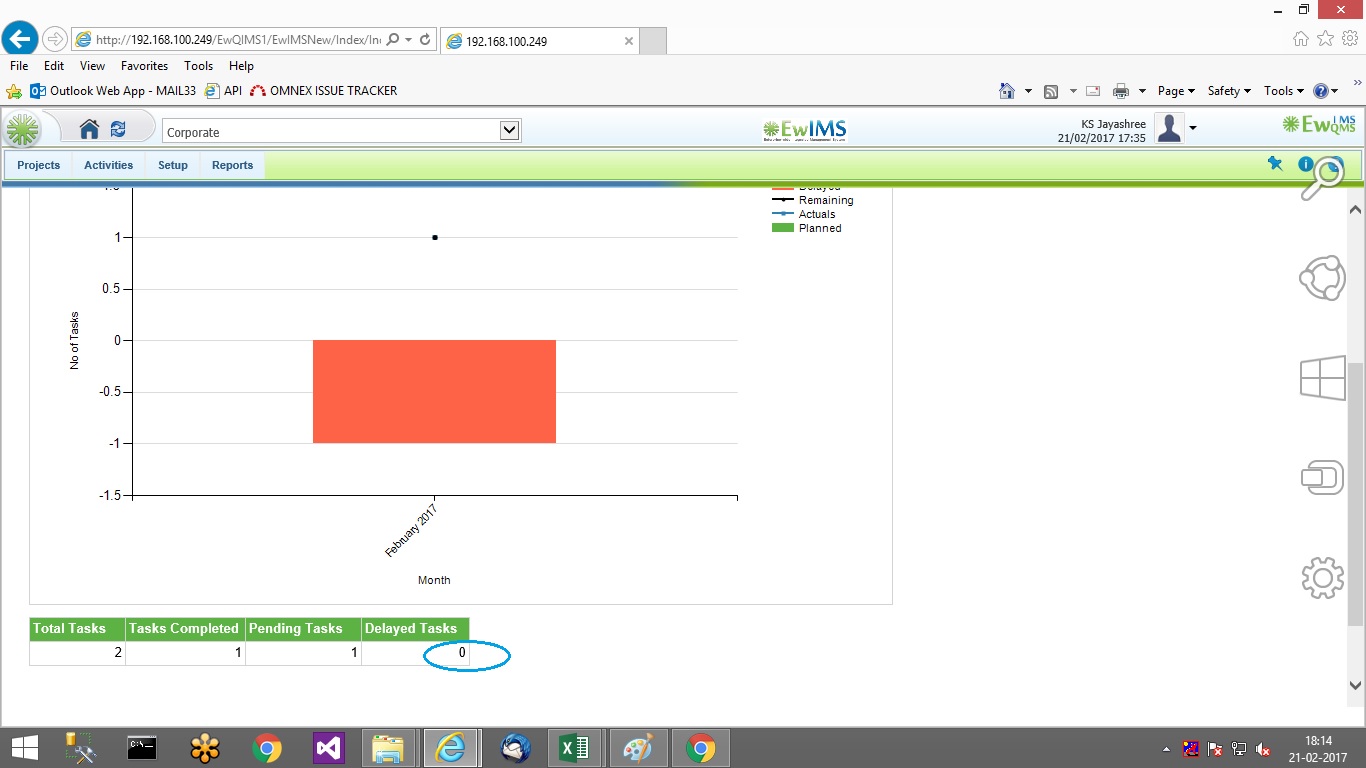
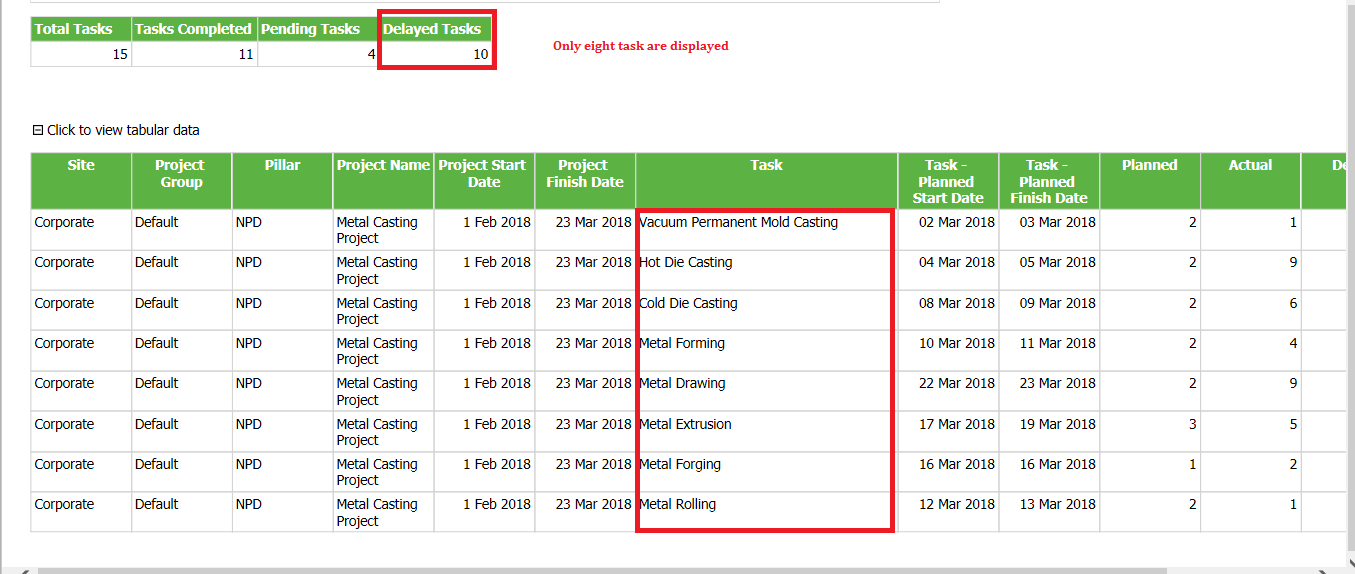
=> The graph displays incorrect values and delayed task item when there are no delayed tasks.
MODULES:
APQPPPAP MGR
Build Cycle:
Cycle 0
Customer:
Issue Dependency:
635
Dev Commitment to Resolve in::
Description
Burndown chart displays incorrect values and delayed task item when there are no delayed tasks.
Files
Actions