Actions
Bug #21666
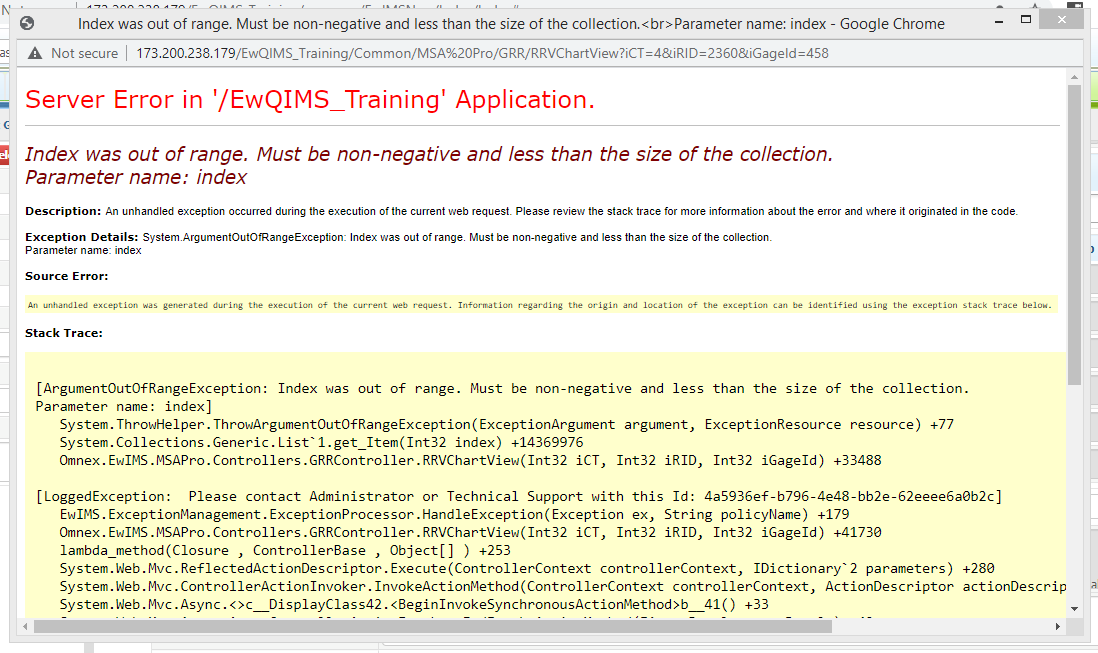
closedR7->Charts->Getting Server error when tries to view the Whiskers chart and Error chart & XY plot of averages->Please refer excel & Screenshot
Start date:
02/16/2021
Due date:
% Done:
0%
Estimated time:
Steps To Reproduce:
1. Click on API link
2. Click on Import button
3. Choose file and Import file
4. Login as a module admin & Select the module as MSA pro
5. Click on Conduct gage RR menu
6. Select the gage for which gage data is imported in API link
7. Click on Show button
8. Click on Calculate and save
9. Click on Whiskers chart
10.Observe the screen
11.Click on Error chart & XY plot of averages
12.Observe the screen
MODULES:
MSAPRO
Build Cycle:
Cycle 1
Customer:
Issue Dependency:
Dev Commitment to Resolve in::
Files
Updated by Prabhu P over 4 years ago
- Status changed from Fixed in Dev to Fixed with Hotfix
Updated by Kiruthika G over 4 years ago
- Status changed from Fixed with Hotfix to Resolved
Updated by Kiruthika G about 4 years ago
- Status changed from Resolved to Closed
Verified as consolidated patch in 50 site Inst4 cascade db
Updated by Kiruthika G almost 4 years ago
- Project changed from SPRINT to SP 10601
Updated by Prabhu P almost 4 years ago
- Status changed from Reopen to Fixed in Dev
Updated by Prabhu P almost 4 years ago
- Status changed from Fixed in Dev to Fixed with Hotfix
Updated by Anonymous almost 4 years ago
- Status changed from Fixed with Hotfix to Resolved
Actions