Usability #18582
closedConduct gagae RR->Please refer description & screenshot
0%
1. Login as Module Admin and select the module as "MSA pro".
2. Click on Conduct gage RR menu
3.Select Variable in Type drop down
4.Click on New button
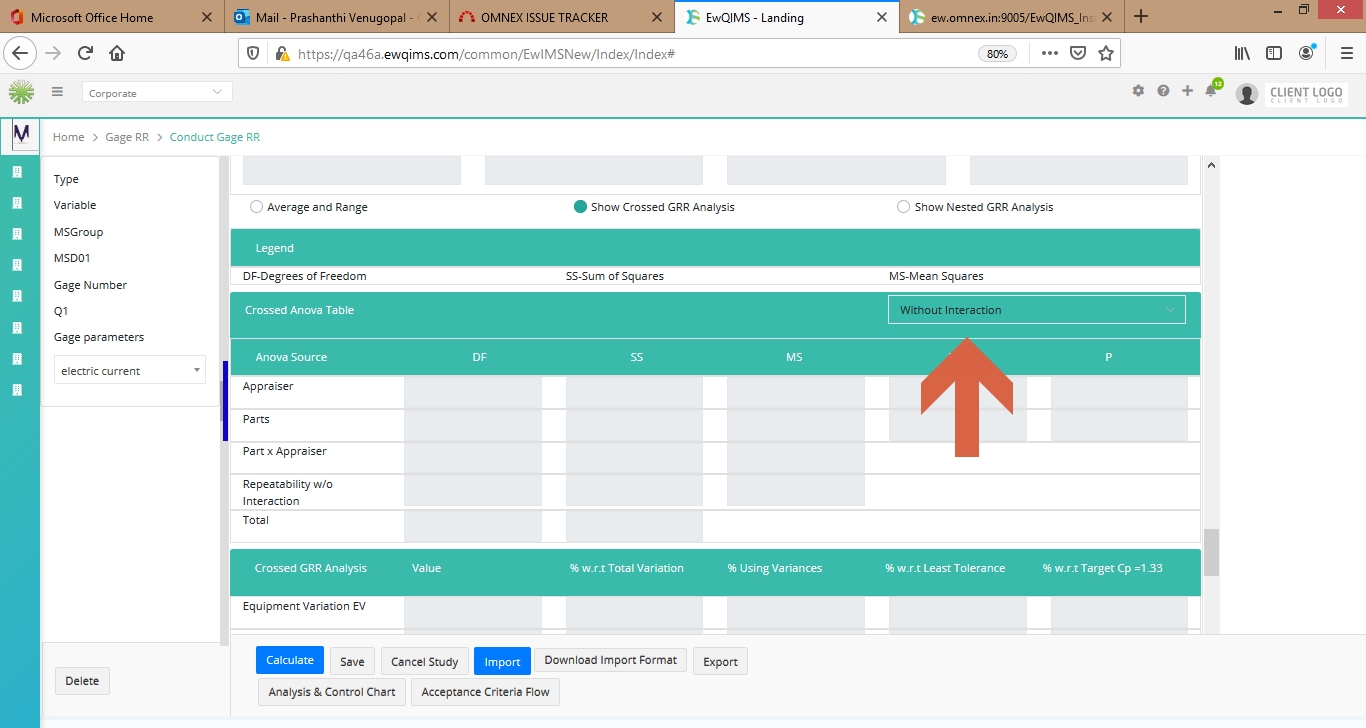
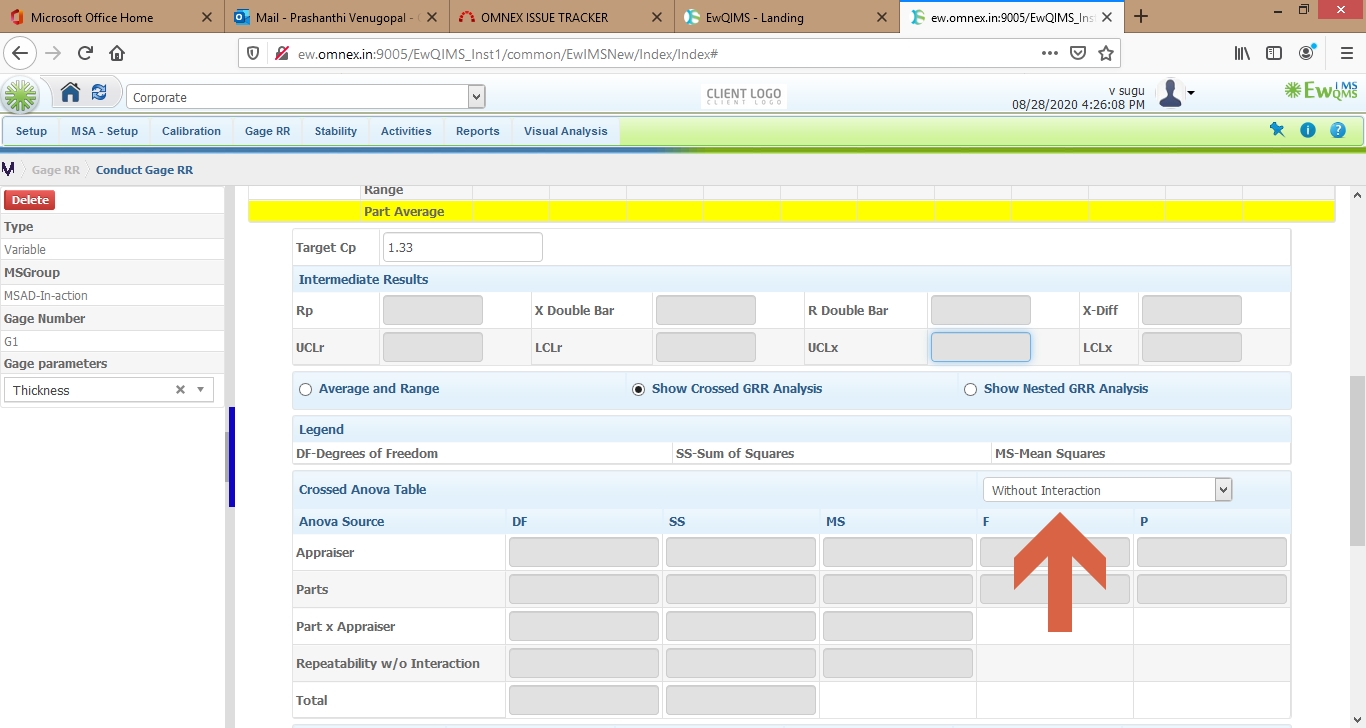
5.Check Show crossed GRR analysis radio button in Data entry screen
6.Observe the Crossed Anova Table drop down (Ex:With interaction & without interaction)
6.Enter all mandatory field ->Click on save button
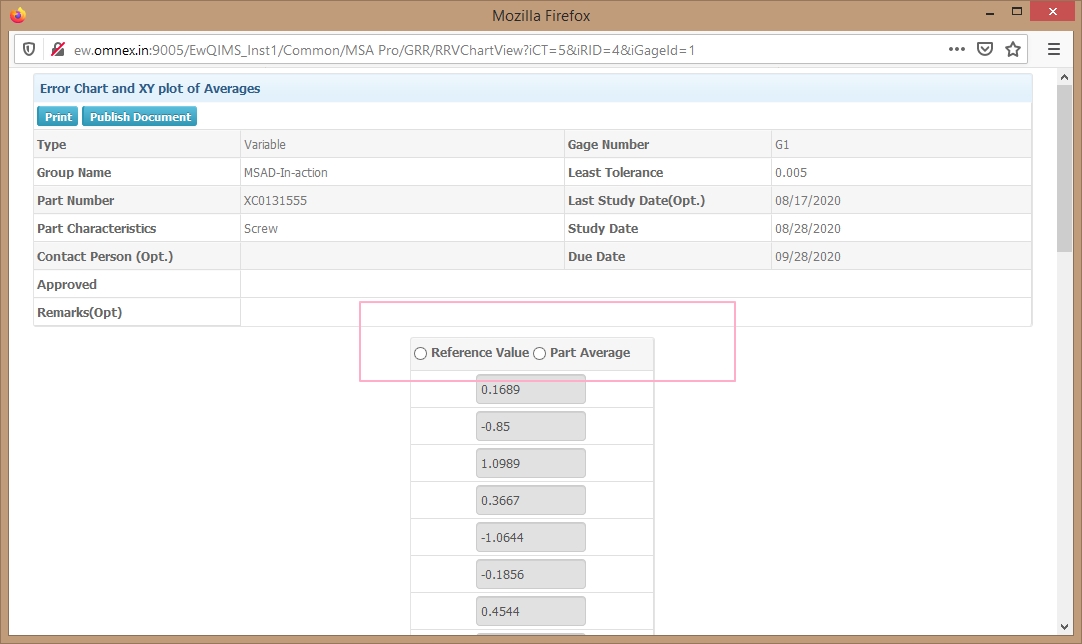
7.Click on Error chart and XY plot of average chart
8.Observe reference value & part average radio button
Description
1)Data entry screen->Crossed Anova Table drop down (Ex:With interaction & without interaction) background should be display in White color but it viewed in green color
2)Error chart and XY plot of average chart->reference value & part average radio button should be display in white color but it viewed in blue color
Files
| UI-W.jpg (278 KB) UI-W.jpg | UI-Crossed Anova Table drop down | ||
| Old-W.jpg (335 KB) Old-W.jpg | Old-Crossed Anova Table drop down | ||
| UI-Radio button.jpg (172 KB) UI-Radio button.jpg | UI-Radio button | ||
| Old-Radio button.jpg (178 KB) Old-Radio button.jpg | Old-Radio button |
Updated by Anonymous almost 5 years ago
- Status changed from Resolved to Fixed with Hotfix
Updated by Anonymous over 4 years ago
- Status changed from Fixed with Hotfix to Closed